Weekly Earthquake Forecast Success
Our Latest On Target Forecast
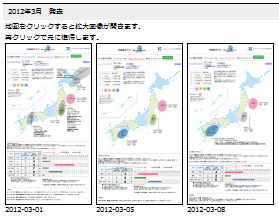
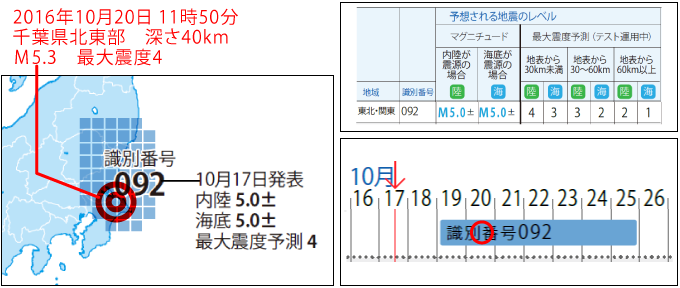
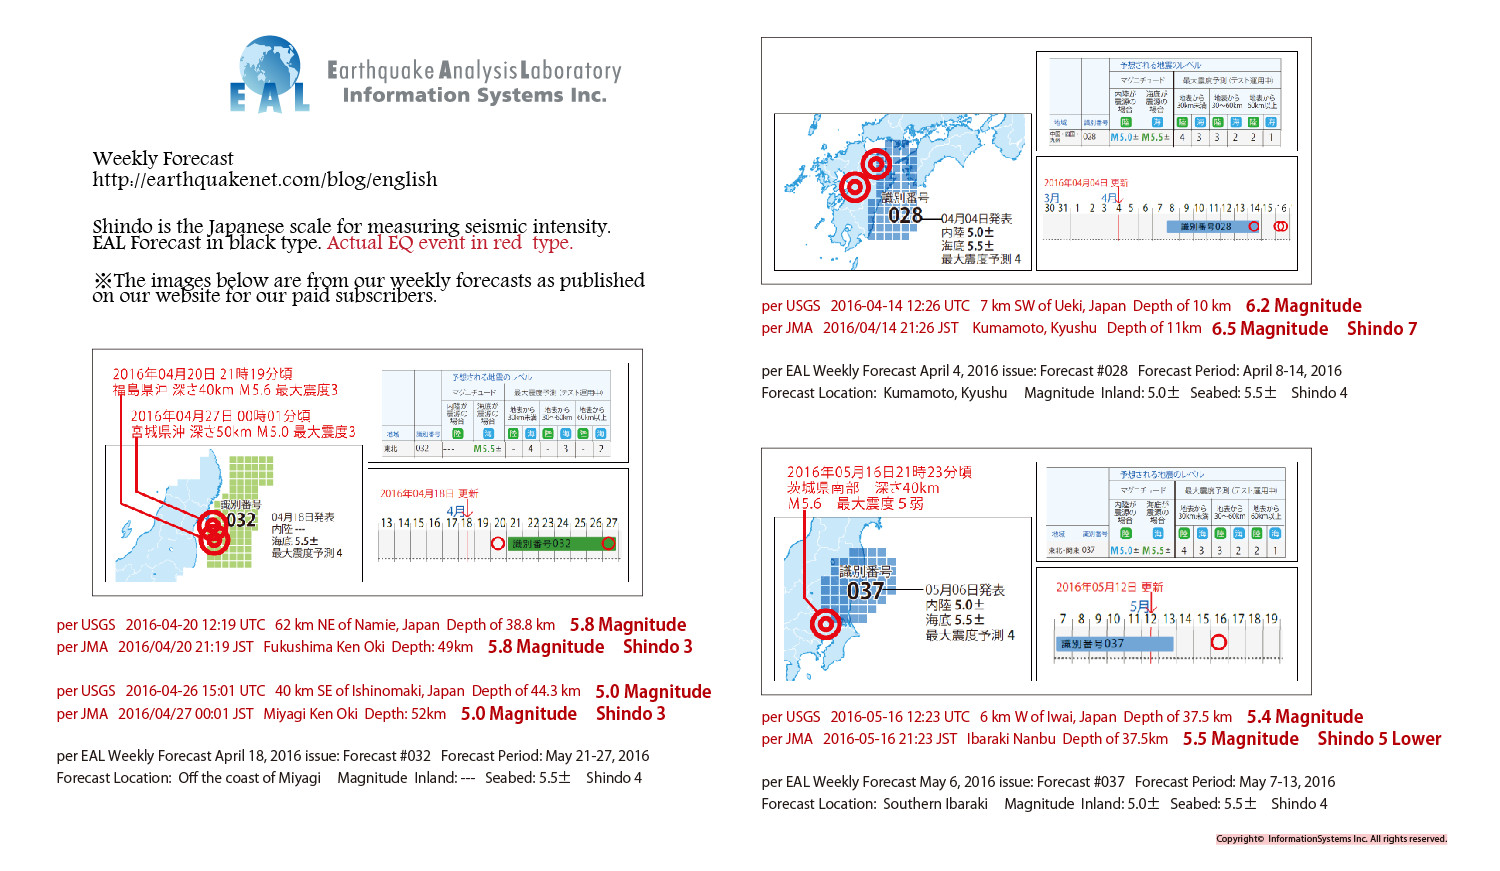
EAL Weekly Forecast is uploaded every Monday and Thursday. We forecast short-term earthquakes in Japan; when, where and the magnitude. At present, forecasts are in Japanese and available by subscription. Below is a translation of a recent on target forecast. Click on the image for a full screen view.
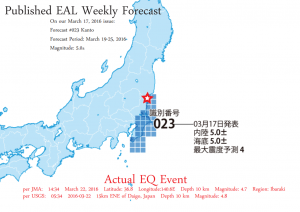
The forecast:
Published on March 17, 2016
Where – Blue squares show the area
When – March 19-25
Magnitude- Inland 5.0± Seabed 5.0±
The star represents the area where the actual earthquake occurred on March 22, 2016.
For more of our recent on target forecasts, go to our Japanese version website,
/blog/ and scroll down.
A primer for reading our forecasts
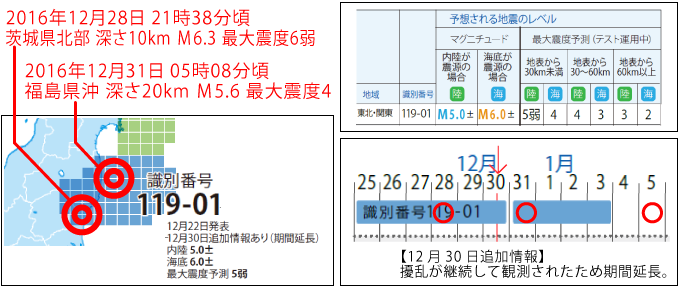
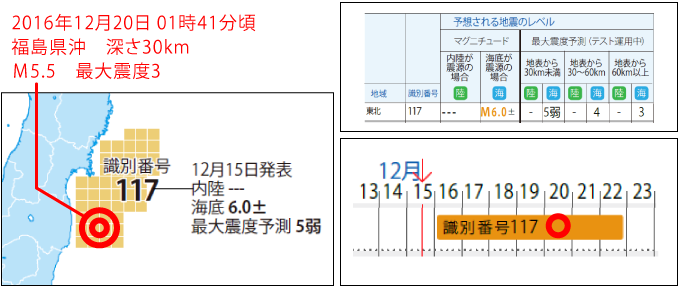
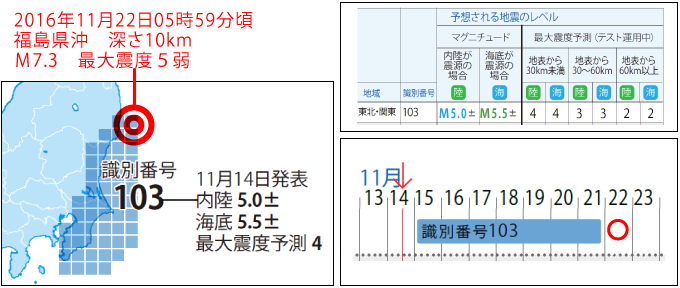
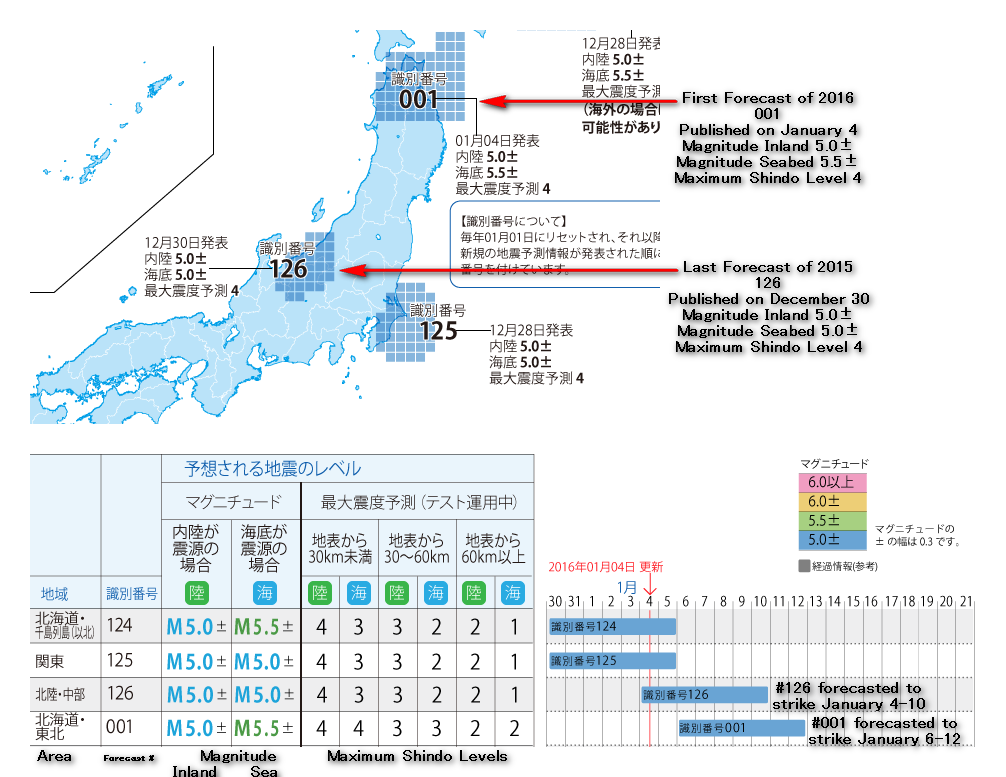
The top section shows the map of Japan. The tiles indicate the area according to our data analysis where a temblor may strike. Temblors are color-coded to indicate the level of magnitude. All of our forecasts are sequentially numbered. The first forecast of the year is numbered as 001. Follow the attached line to see the date of publication, magnitude for land and sea then the maximum shindo level .
Below the map is the calendar section. The date of publication is in red with an arrow indicating the date to show where the forecasts are; to the right of the arrow shows means the forecast is active. (To the left means the forecast is inactive therefore the color is grey.) On the left of the calendar shows further information for each forecast. Area, forecast number, magnitude for land and sea followed by maximum shindo levels for three categories – minimum 30 km from the earth’s surface, 30-60 km from the earth’s surface and over 60 km from the earth’s surface.
Archive
EAL Weekly Forecast is published twice a week and available through paid subscription only.
View past forecasts here or by clicking on any of the images below.
